

But despite that, average house prices held up across England – even if there was a drop in sales.
It was the same picture in Northumberland where prices rose by 3.2% in the year to September 2020.
Across the North East, prices rose by 0.7%.
The ONS also publishes house price figures by Middle Layer Super Output Areas (MSOAs) – small geographic areas containing an average of 7,200 people.
These show 19 of the 40 MSOAs that make up Northumberland saw a rise in house prices over the same period.
Here we reveal which neighbourhoods saw the strongest growth in the year to September 2020.
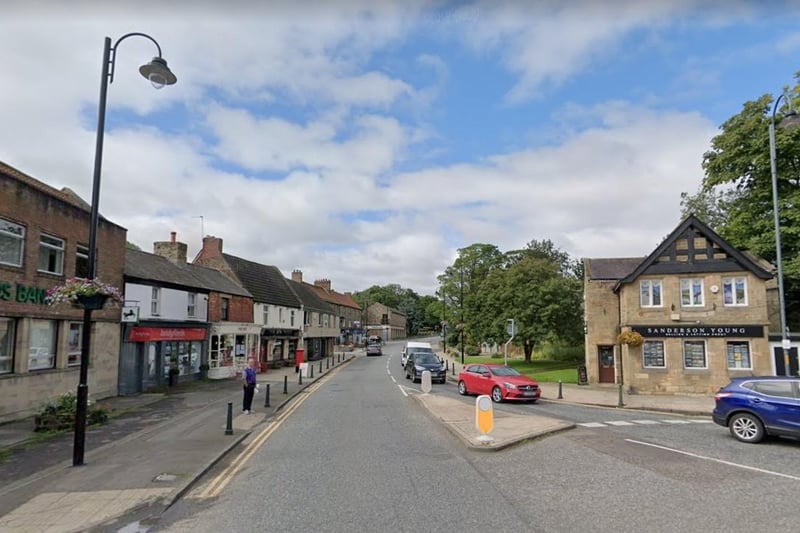
1. Ponteland
The biggest price hike was in Ponteland where the average price rose to £390,705, up by 25.8% on the year to September 2019. Overall, 139 houses changed hands here between October 2019 and September 2020, a rise of 9%. Photo: Google
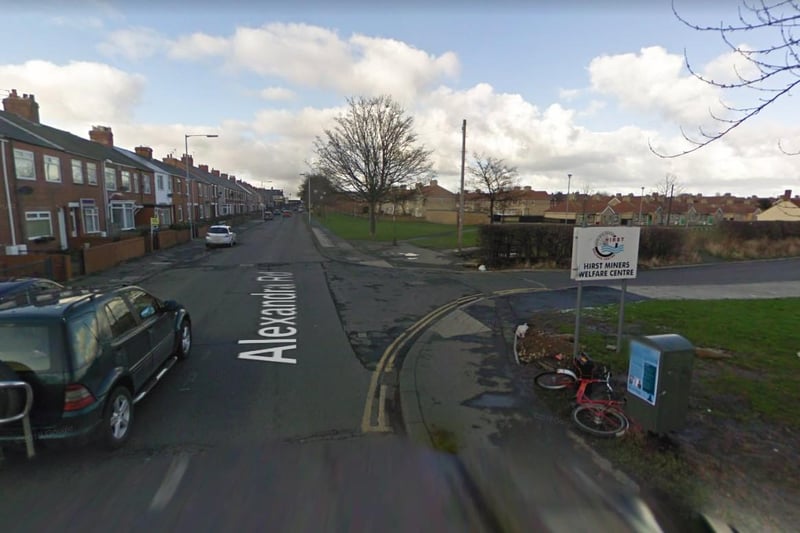
2. Ashington Hirst
The 2nd biggest price hike was in Ashington Hirst where the average price rose to £66,917, up by 22.1% on the year to September 2019. Overall, 62 houses changed hands here between October 2019 and September 2020, a drop of 26%. Photo: Google
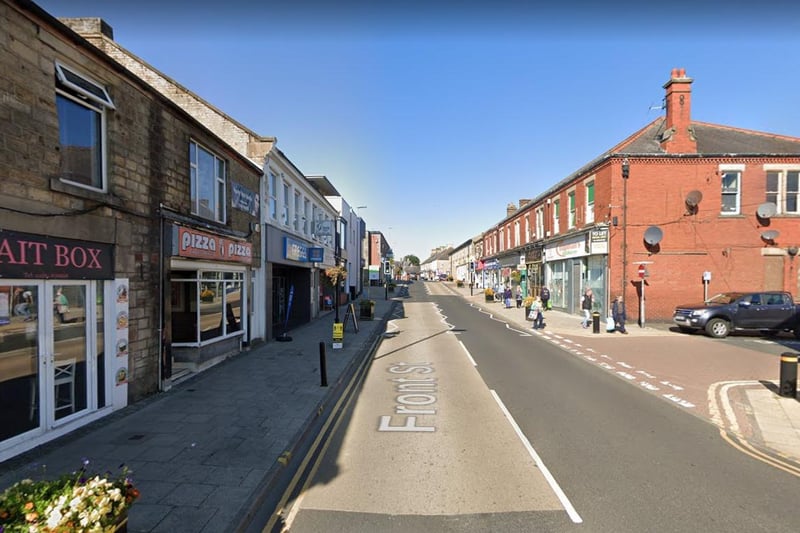
3. Prudhoe
The 3rd biggest price hike was in Prudhoe where the average price rose to £186,466, up by 15.9% on the year to September 2019. Overall, 116 houses changed hands here between October 2019 and September 2020, a drop of 14%. Photo: Google
![The 4th biggest price hike was in Bedlington Station and Sleekburn where the average price rose to £107.955, up by 14.5]% on the year to September 2019. Overall, 111 houses changed hands here between October 2019 and September 2020, a drop of 3%.](https://www.hartlepoolmail.co.uk/webimg/b25lY21zOjBiNGU5ZTQzLWZlOTYtNDNkNS05NjZiLTExNjc0MTlkNDQ1NDphZTQwNDhhNC1lMTE3LTRmNmQtYTU5Ni01MTc0MTYyMWZiN2U=.jpg?crop=3:2&width=800)
4. Bedlington Station and Sleekburn
The 4th biggest price hike was in Bedlington Station and Sleekburn where the average price rose to £107.955, up by 14.5]% on the year to September 2019. Overall, 111 houses changed hands here between October 2019 and September 2020, a drop of 3%. Photo: Google